Dashboard
The dashboard is the landing page after logging in. It gives you an at-a-glance overview of your cellar.
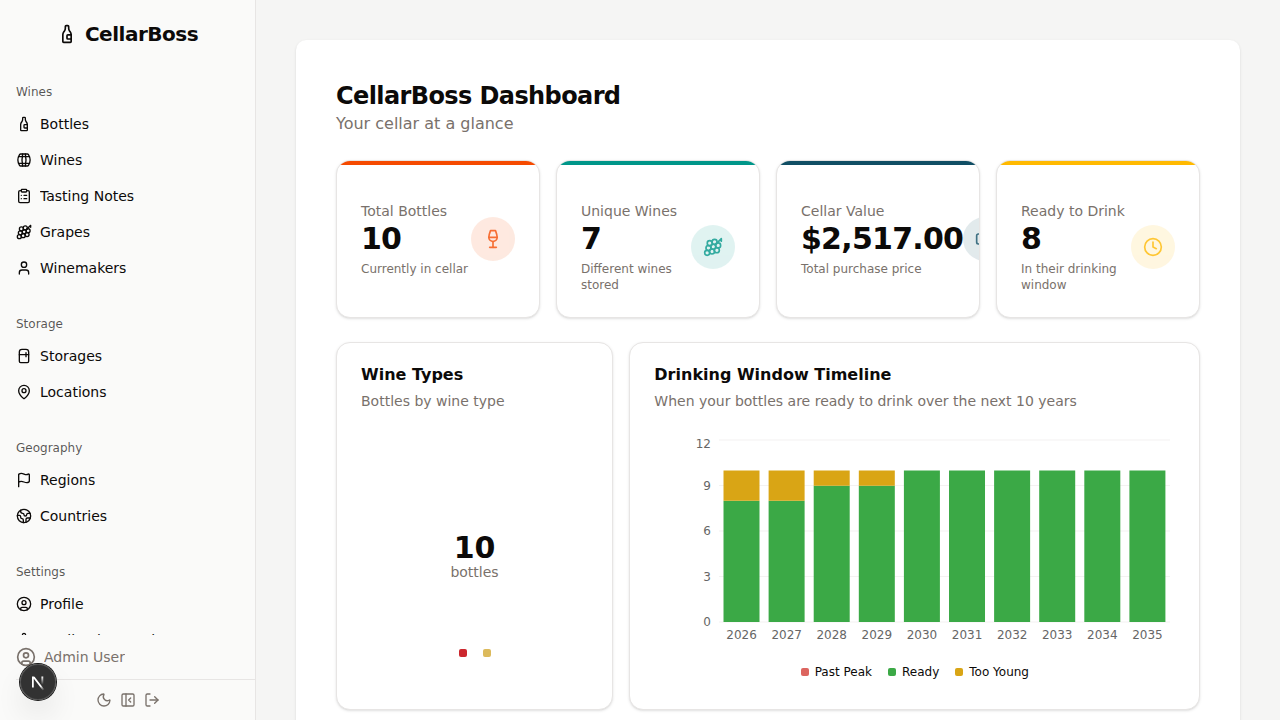
Overview Stats
Four stat cards are displayed at the top of the dashboard:
| Stat | Description |
|---|---|
| Total Bottles | Number of bottles currently stored in your cellar |
| Unique Wines | Number of distinct wines across stored bottles |
| Cellar Value | Total purchase price of all stored bottles |
| Ready to Drink | Bottles currently within their drinking window |
Charts
Wine Type Breakdown
A donut chart showing the proportion of bottles by wine type (red, white, rosé, etc.). Click any segment to navigate to the bottles page filtered by that type.
Country Distribution
A bar chart showing how many bottles you have from each country. Click a bar to navigate to the bottles page filtered by that country.
Drinking Window Timeline
A stacked bar chart showing how your bottles are distributed across drinking windows, grouped by year. Each bar is split into Ready, Too Young, and Past Peak segments.
Cellar Value Over Time
An area chart tracking the cumulative value of your cellar over time based on purchase dates and prices.
Lists
Drinking Suggestions
Bottles that are approaching the end of their drinking window and should be considered for drinking soon. Each suggestion links to the bottle detail page.
Top Rated Wines
Your highest-rated wines based on tasting note scores. Each entry links to the wine detail page.
Recent Activity
A timeline of your latest cellar activity, including recent purchases and tasting notes.